
This is not financial advice. Anything stated in this article is for informational purposes only and should not be relied upon as a basis for investment decisions. Triton may maintain positions in any of the assets or projects discussed on this website. Triton Limited is incorporated in the Abu Dhabi Global Market (“ADGM”) and is regulated by the Financial Services Regulatory Authority (“FSRA”) under Financial Services Permission number 240017.
TL;DR
When Markets Hold Against the Storm
Markets rarely deliver clarity during chaos. This past weekend offered something rarer still: a clear signal of resilience when none should have existed.
On Saturday, February 28, the United States and Israel launched coordinated military strikes across Iran, killing Supreme Leader Ali Khamenei and triggering the most significant geopolitical crisis since the Iraq War. The conflict created what the International Energy Agency described as "the largest supply disruption in the history of the global oil market," with at least 10 million barrels per day of crude production cut by March 10 as the Strait of Hormuz - a chokepoint through which roughly 20% of global oil demand transits - effectively closed.
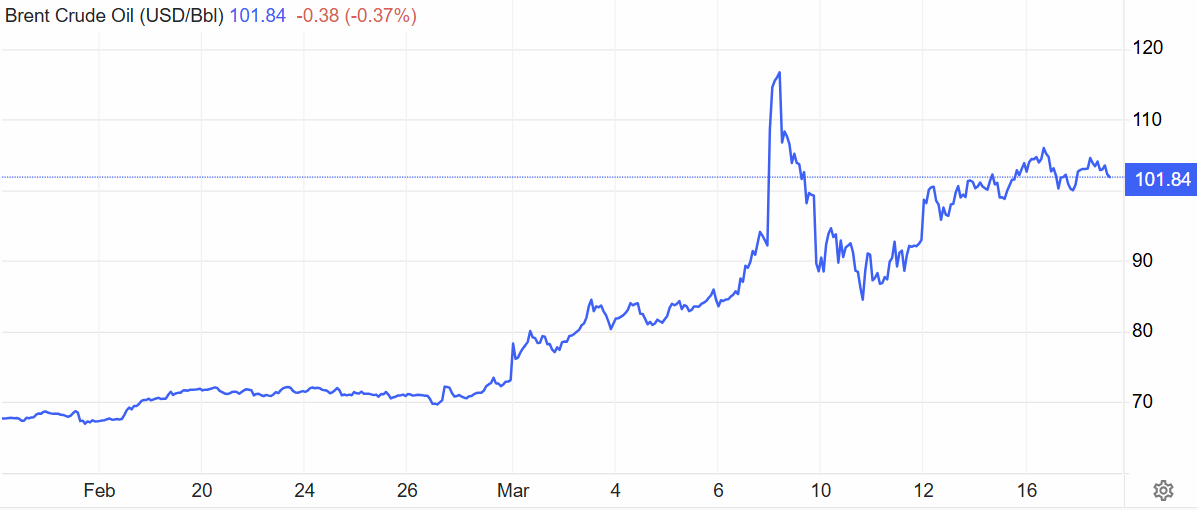
Brent spiked as high as $119.50 during the disruption before falling back toward the $100 area by March 12, while broader energy markets repriced sharply as shipping, insurance, and physical flows were disrupted. Traditional markets froze, execution windows narrowed, and global macro uncertainty surged.
And crypto held.
Despite extraordinary turbulence, cryptocurrency markets did not break critical support levels. Bitcoin, which had spent much of February consolidating after a sharp deleveraging phase, absorbed the weekend shock without cascading into renewed forced selling. Ethereum and Solana followed similar paths, declining modestly but maintaining structural support. That is not typical behavior during acute geopolitical stress. When news of this magnitude fails to drive a fresh leg lower, it often suggests that much of the capitulation has already occurred.
At Triton, we view that resilience as constructive, not because geopolitical risk has disappeared, but because the market demonstrated an ability to absorb extraordinary stress without collapsing.
Year-to-Date Performance: A Necessary Reset
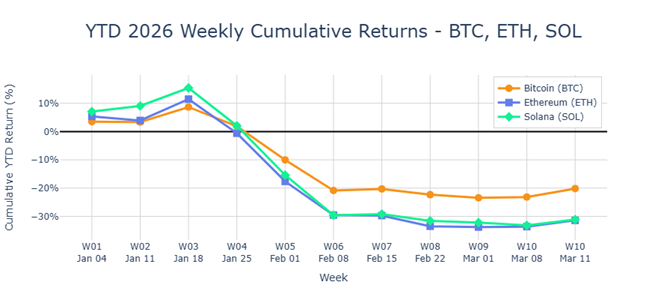
The first two months of 2026 tested conviction across the board. As of March 12, major crypto assets remain materially lower year-to-date:
Source: Triton internal LLM analysis based on data from CoinMarketCap, CoinGecko, and other public sources.
These declines have been significant, but the market signal is cleaner than the price action suggests. The move has reflected positioning unwinds, aggressive deleveraging, and macro uncertainty more than a collapse in structural fundamentals. In liquidity-led selloffs, this relative performance is typical: capital consolidates in the most liquid asset, while higher-beta alternatives absorb a disproportionate share of the selling pressure.
What Drove the Selloff
The decline that preceded this weekend's geopolitical escalation did not begin with missiles. It began with policy uncertainty and systematic deleveraging.
1. The Warsh Nomination
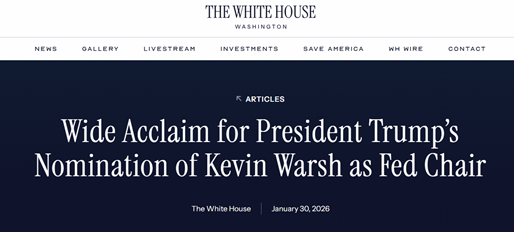
On January 30, President Trump said Kevin Warsh would be his choice to succeed Jerome Powell as Federal Reserve Chair when Powell’s term as Chair ends in mid-May. Warsh, a former Fed Governor with a more hawkish reputation on inflation and central-bank credibility, immediately introduced uncertainty around the future path of U.S. monetary policy. Markets interpreted the move as a potentially more restrictive policy signal, which pressured risk assets broadly. Crypto, sitting at the higher end of the beta spectrum, sold off early and hard. Reuters later reported that Warsh’s formal nomination process was also moving ahead in early February.
2. Aggressive Deleveraging and Institutional Outflows
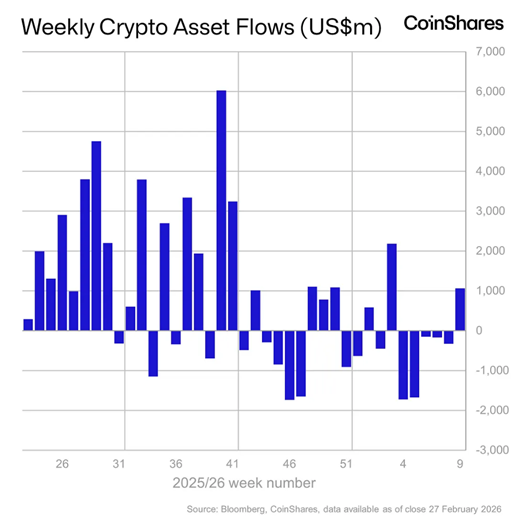
The recent leg lower can be explained without leaning on narrative alone. Deleveraging remains the cleanest mechanism: when positioning is crowded and volatility rises, liquidation-driven selling tends to dominate. That dynamic was reinforced by flows, with digital-asset investment products recording five consecutive weeks of outflows totaling roughly $4.3 billion through late February, according to CoinShares.
Persistent outflows matter because they erode the marginal bid and often turn rebounds into rebalancing opportunities rather than genuine trend reversals. At the same time, cascading liquidations and the unwinding of overleveraged positions intensified sell pressure and accelerated the move lower. Macro risk-off conditions added a second layer, as the tape became increasingly sensitive to headlines affecting inflation, oil, and rates, precisely where risk assets are most vulnerable. Unlike prior crypto corrections driven mainly by idiosyncratic factors, this drawdown appears to reflect the convergence of positioning, flows, and macro, all moving in the same bearish direction at once.
3. Macro Uncertainty and Technical Breakdown
That broader risk-off backdrop also fed into a technical breakdown. As Bitcoin moved through key support levels, stop-losses were triggered and downside momentum compounded. Against this backdrop, the weekend’s geopolitical escalation should have pushed prices materially lower. It did not. That divergence is significant.
4. Capital Flows: From Capitulation to Stabilization
After five consecutive weeks of outflows totaling $4.3 billion, crypto ETPs recorded $1.0 billion in net inflows in the week ended March 2, followed by a further $619 million in the week ended March 9. CoinShares noted that the later week still saw strong early demand offset by late-week outflows as oil prices rose and markets reassessed inflation risks.
The pattern is instructive. Bitcoin products led the initial rebound, while Ethereum also saw renewed demand. Even so, the broader message is not that conviction has fully returned, but that redemption pressure has eased and positioning has become cleaner. Total assets under management rebounded from the lows, but remained below the October 2025 peak, suggesting sentiment has stabilized without yet returning to euphoric levels. That is more consistent with base-building than with a fully confirmed trend reversal.
Sentiment: Capitulation Without Recovery
Sentiment reached a genuine extreme in February. The Crypto Fear & Greed Index fell to 5 on February 12, 2026, matching the lowest reading in its history and signaling a true capitulation event in which weak hands exited and positioning compressed sharply. Extreme fear persisted through the month, with the index revisiting similarly depressed levels again later in February as Bitcoin tested local lows.
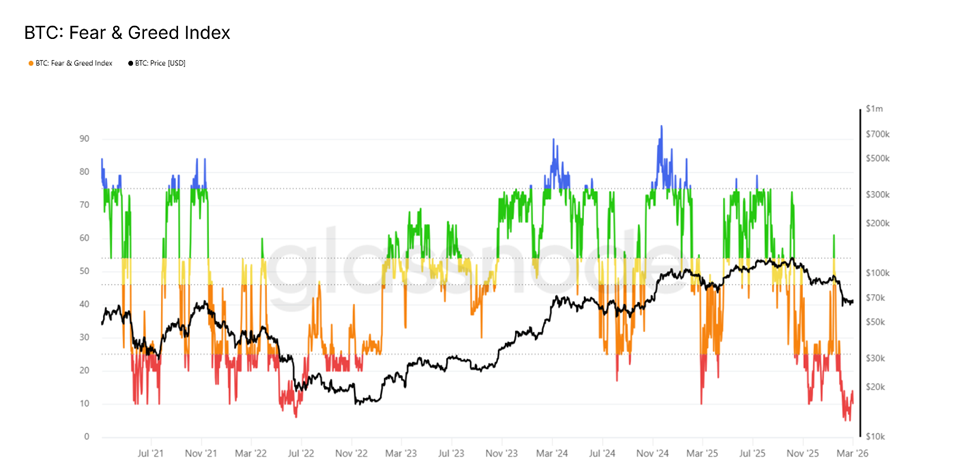

The clearest interpretation is not outright bullishness, but stabilization after forced selling. Historically, such ultra-low readings have tended to coincide with widespread panic, washed-out positioning, and, at times, local bottoms or the setup for strong reversals. By early March, the index had recovered modestly but remained in “Extreme Fear” territory, consistent with a market where panic selling appears largely exhausted, even if confidence has not yet returned.
Valuation: Assets Trading Below Historical Norms
For digital assets with measurable cash flows, valuation multiples have compressed meaningfully relative to prior cycle highs, placing parts of the market back at levels that appear more attractive on a historical basis.
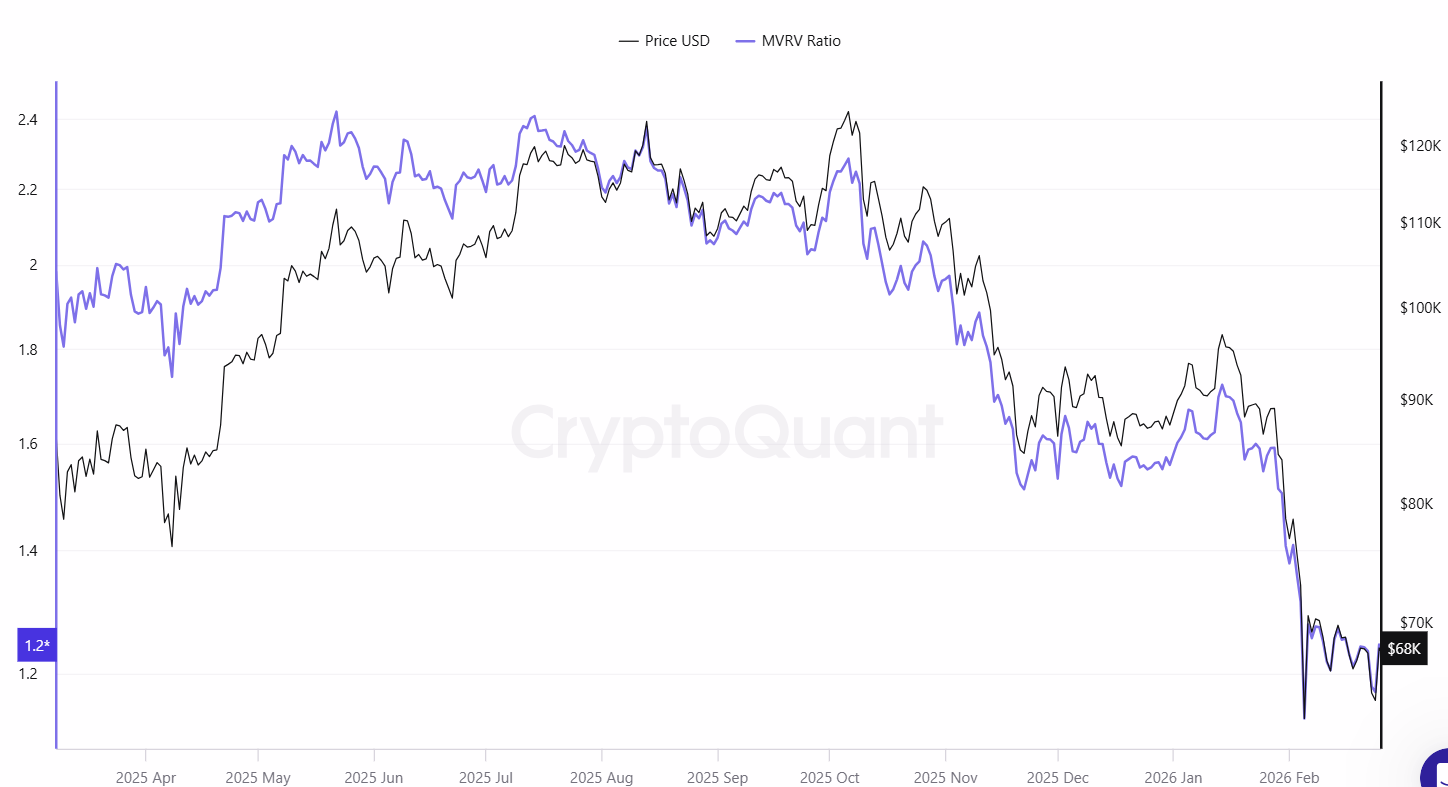
For assets such as Bitcoin that do not generate traditional cash flows, the market often relies on the MVRV ratio to assess valuation relative to aggregate cost basis. While the ratio is not yet in deep undervaluation territory, it has compressed materially from prior highs and now sits near the lower end of its recent historical range. This suggests valuation has reset significantly, even if the market has not yet entered a classic distressed regime.
As of early 2026, other large-cap assets such as XRP and Cardano also saw 30-day MVRV readings fall into negative territory, implying that recent buyers were, on aggregate, underwater. Historically, that kind of positioning has tended to coincide with capitulation among weaker holders and improved forward risk-reward for longer-term accumulators, though it does not by itself guarantee an immediate reversal.
Fundamentals and Market Structure
This section is intentionally literal: the claim is not that fundamentals guarantee price, but that the dashboards being tracked do not depict a collapse in activity.
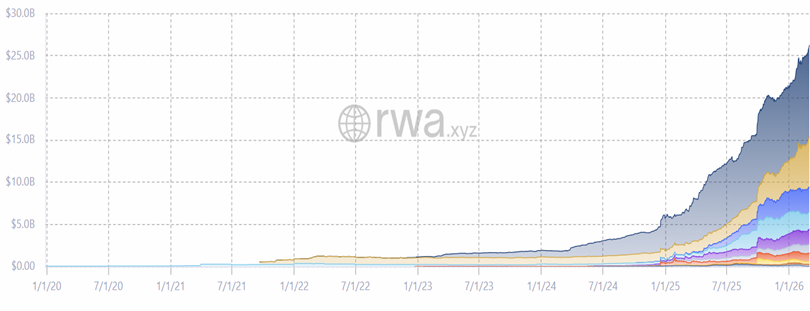
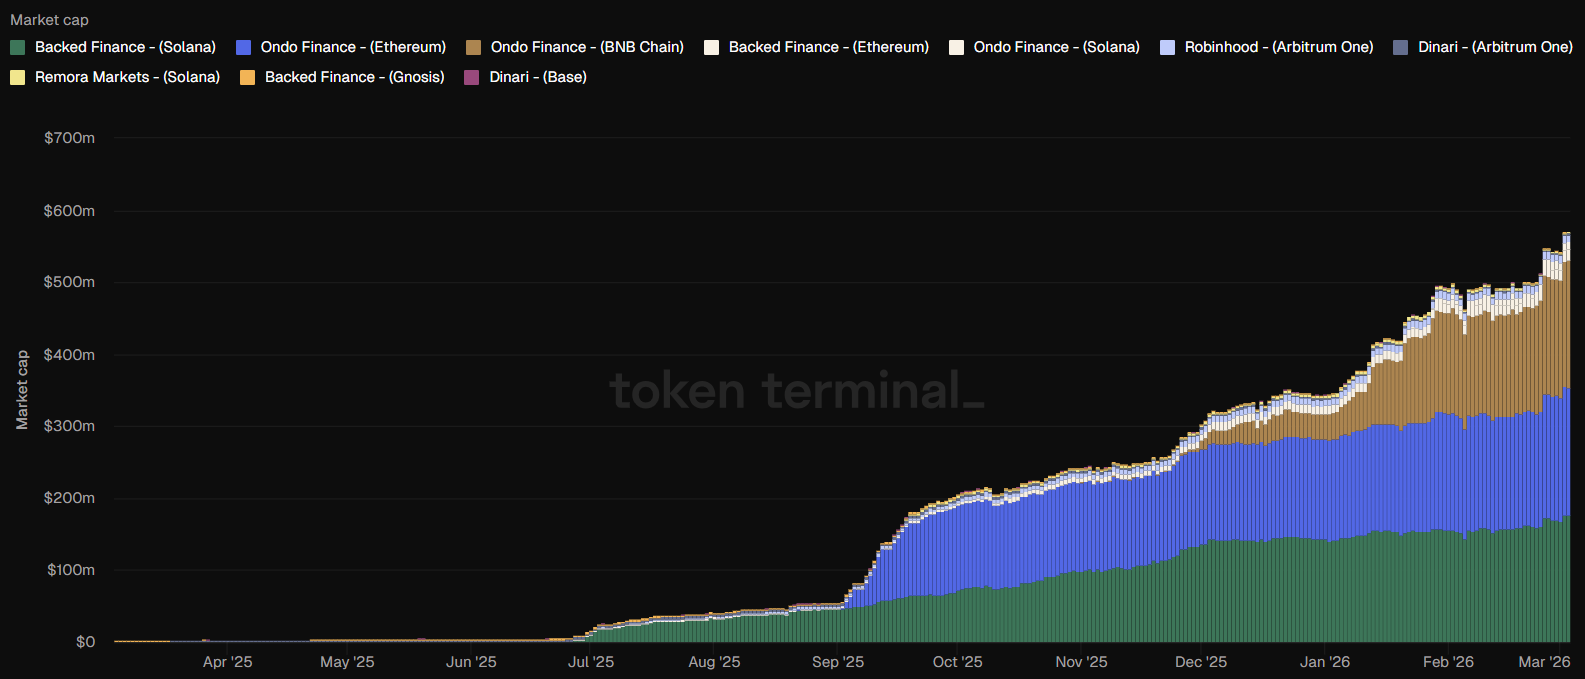
Tokenization AUM continues to scale. Weekly series tracking tokenized real-world assets have trended higher across tracked asset types throughout the drawdown period. This is a slower-moving adoption series than trading volumes or spot prices, and its continued growth indicates that institutional adoption of on-chain infrastructure is proceeding independently of short-term price action.
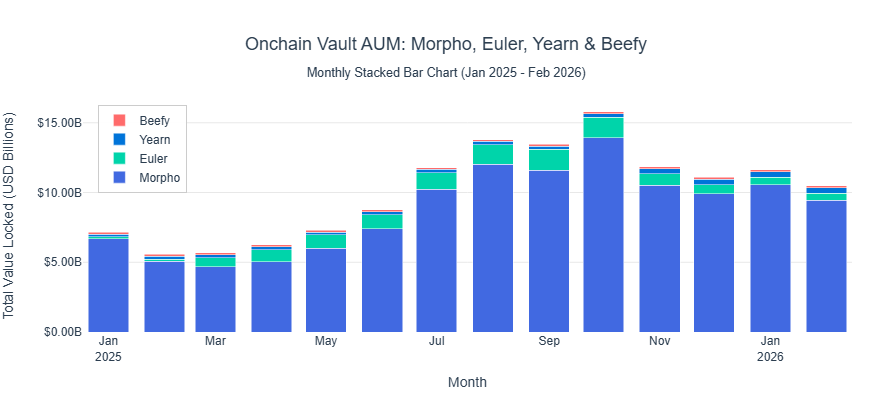
On-chain vault AUM continues to expand. TVL is materially higher than a year ago, rising from roughly $5.9 billion in early 2025 to about $10.3 billion by February 2026, even after a post-peak pullback following the September high. The composition also matters: growth has been concentrated in Morpho, while smaller venues such as Euler have posted rapid gains off a lower base. Net, on-chain credit capacity is scaling rather than contracting through a weak spot tape.
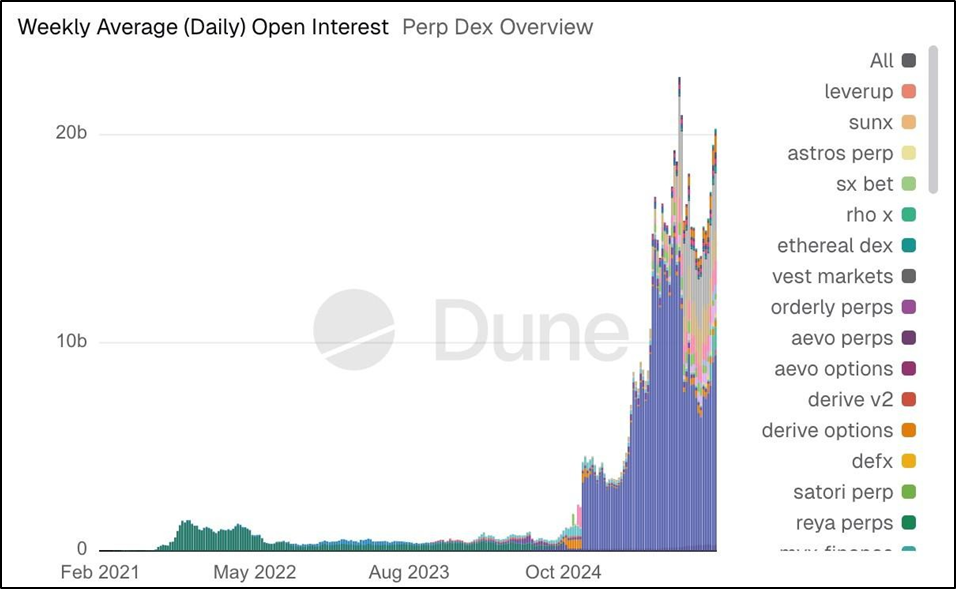
Perp DEX activity remains structurally large. Derivatives continue to function as the primary venue for risk transfer during weak spot conditions. The perpetuals market remains the marginal price discovery mechanism for most digital assets, and on-chain open interest levels, while compressed from the October 2025 highs, remain orders of magnitude above pre-2024 levels.
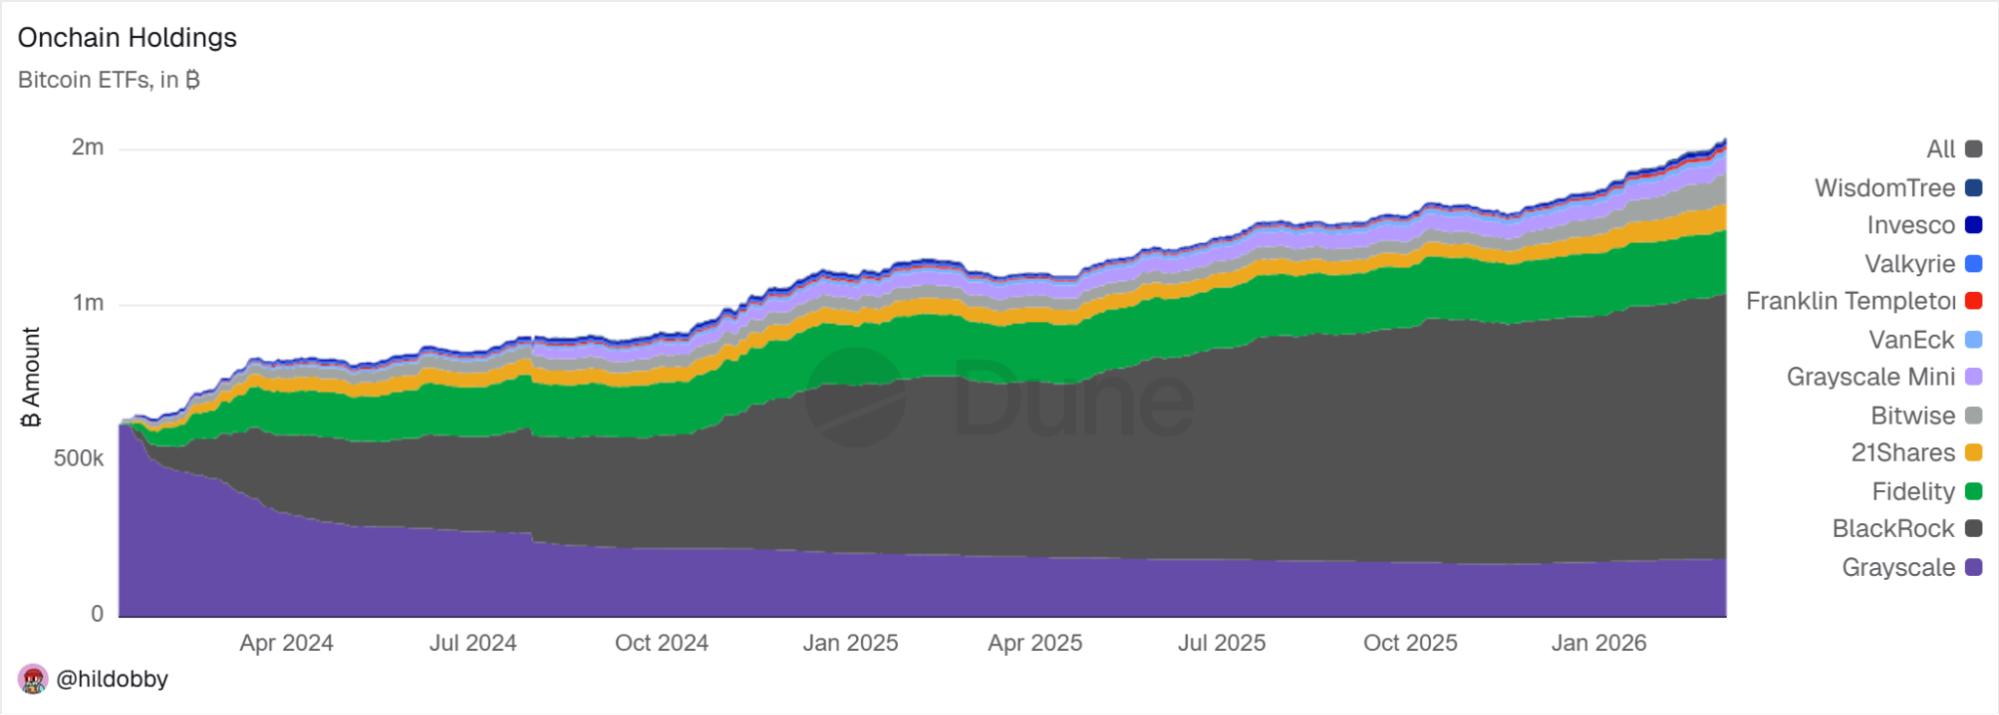
Spot BTC ETF holdings remain strong and continue to trend higher. Total on-chain BTC held by the ETF complex has climbed steadily since launch, with growth in BlackRock and Fidelity more than offsetting ongoing reductions in Grayscale. The net effect is a structurally larger institutional holder base and a persistent source of demand through the ETF wrapper, even as allocations rotate across issuers.
Conclusion
This drawdown has looked more like a macro-driven deleveraging event than a breakdown in crypto’s structural foundations. Positioning, flows, and policy uncertainty drove the selloff, but the market’s ability to absorb a major geopolitical shock without losing key support suggests that much of the forced unwind may already have occurred.
That does not imply an immediate reversal. Sentiment remains fragile, macro risk is still elevated, and near-term price action is likely to stay sensitive to energy, inflation, and rates. But several of the key indicators tracked here, including ETP flows, valuation resets, tokenization growth, on-chain credit expansion, perp DEX activity, and spot BTC ETF holdings, point more toward stabilization than deterioration.
The broader takeaway is straightforward: price has weakened more than structure. In that sense, this remains a post-deleveraging tape, where the right framework is to focus on measurable inputs rather than narrative swings. The base case remains near-term consolidation with a modest downside bias, but the underlying setup increasingly resembles a market that is rebuilding from capitulation rather than entering a fresh phase of structural decline.

Triton fully exited liquid assets by June 3 as macro pressure, ETF outflows, weak market structure, and capital rotation turned crypto risk-reward negative. The decision was not driven by broken fundamentals, but by a market where downside risk outweighed upside until clearer re-entry signals emerge.

We see Q1 2026 as a rare asymmetric crypto entry point—fundamentals are intact, valuations reset, and sentiment is at multi-year lows—positioning our long-horizon capital to capture potential outsized returns through our vertical-focused, data-driven approach.

Perpetual swaps have achieved product-market fit in crypto and are now scaling via decentralized exchanges like Hyperliquid, with improving execution and liquidity. The next growth phase lies in capturing retail derivatives flow - especially vs CFDs - supported by new infrastructure enabling expansion beyond crypto.