
Disclaimer: This is not financial advice. Anything stated in this article is for informational purposes only and should not be relied upon as a basis for investment decisions. Triton may maintain positions in any of the assets or projects discussed on this website.
TL;DR
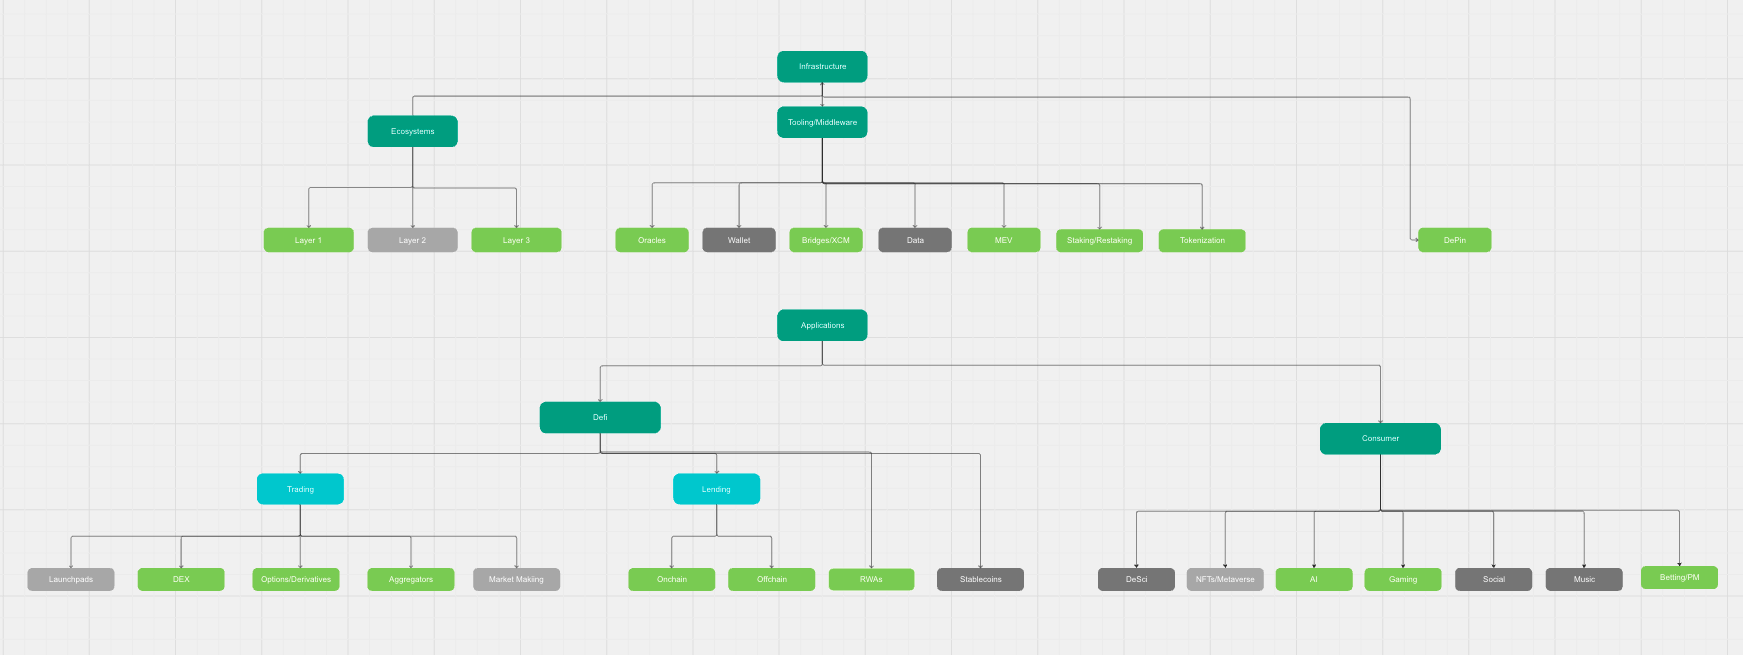
Triton Taxonomy: How Triton Liquid Delineates Verticals
One of the most persistent analytical errors in crypto markets is the tendency to treat “crypto” as a single, monolithic asset class. This framing is convenient, but fundamentally wrong.
The only meaningful characteristic shared by all crypto assets is that they exist on blockchain infrastructure. Beyond that, tokens differ radically across cash-flow profiles, risk drivers, user behavior, valuation frameworks, and macro sensitivities. Lumping them together obscures signals, inflates correlation assumptions, and leads to systematic mispricing.
At Triton Liquid, our research process begins by rejecting the idea that crypto is one market. Instead, we construct a vertical-based taxonomy that allows us to compare assets apples-to-apples, just as public-market investors would never value a payments company like a semiconductor manufacturer simply because both are “equities.”
This post outlines how Triton delineates crypto verticals - and critically, which quantitative KPIs matter in each one.
Below is our internal taxonomy, which we use to differentiate asset categories.
The Core Principle: Structure Before Valuation
Before modeling price, returns, or catalysts, Triton first asks:
What economic role does this token play?
Only once an asset is placed in the correct vertical can meaningful quantitative analysis begin. Each vertical has its own signal set. Applying DeFi metrics to infrastructure - or consumer growth metrics to middleware - produces noise, not insight.
Layer I: Infrastructure - The Base of the Stack
Infrastructure assets are long-duration networks. Triton treats these closer to platform equities than speculative instruments.
Ecosystems (L1s and L2)
Primary KPI categories Triton tracks:
Network Usage
Developer Activity
Economic Sustainability
Capital Flows
Example application:
Solana vs Ethereum is evaluated on fee generation per user, developer growth momentum, and stablecoin inflows, not narrative or headline TPS claims.
DePIN (Decentralized Physical Infrastructure Networks)
DePIN protocols coordinate real-world resource provisioning through token incentives. Unlike purely digital protocols, these networks exhibit supply-side capital formation, operational constraints, and utilization risk, making traditional crypto metrics largely insufficient.
Triton evaluates DePIN assets using a two-sided infrastructure scorecard, explicitly separating capacity creation from paid demand.
Core KPI Categories Triton Tracks:
Network Supply
Utilization & Demand
Unit Economics
Token Sustainability
Capital Efficiency
Network Reliability
What Triton Explicitly Does Not Optimize For
Practical Application
A DePIN network growing node count 3× with flat paid usage is treated as a negative signal, not growth. Conversely, a network with stable capacity but rapidly increasing revenue per node may indicate an approaching inflection point in capital efficiency.
In short, Triton treats DePIN less like “crypto infrastructure” and more like early-stage physical infrastructure businesses coordinated by software, where utilization, unit economics, and subsidy discipline determine long-term value.
Example application:
Render is analyzed on GPU utilization and revenue per node, not wallet count or TVL.
Wallets
Primary KPIs:
Wallets are distribution assets first, monetization assets second.
Bridges / Cross-Chain Messaging
Primary KPIs:
MEV
Primary KPIs:
MEV assets are market-structure plays, not passive yield instruments.
Staking / Restaking
Primary KPIs:
Layer III: Applications - Demand-Driven Assets
Applications are evaluated primarily on economic activity, not theoretical TAM.
DeFi Applications
Trading (DEXs, Derivatives)
Primary KPIs:
Hyperliquid is evaluated like an exchange, not a “protocol.”
Lending
Primary KPIs:
RWAs introduce credit-cycle sensitivity, which Triton explicitly models.
Stablecoins
Primary KPIs:
Stablecoins are monetary instruments, not growth tokens.
Consumer Applications
Consumer crypto behaves more like media and entertainment, with power-law outcomes.
Primary KPIs:
These assets are often optionality-driven, with weaker near-term cash flows but asymmetric upside.
Why KPI Discipline Matters
Using the wrong metrics creates false conclusions:
Triton’s vertical framework ensures that each asset is judged by the metrics that actually drive value.
LVC Approach
Triton applies venture-style underwriting to liquid markets. That requires:
Crypto is not one market. It is a stack of industries, each with its own accounting logic.
Understanding which metrics matter - and which do not - is where durable alpha is created.

Triton fully exited liquid assets by June 3 as macro pressure, ETF outflows, weak market structure, and capital rotation turned crypto risk-reward negative. The decision was not driven by broken fundamentals, but by a market where downside risk outweighed upside until clearer re-entry signals emerge.

We see Q1 2026 as a rare asymmetric crypto entry point—fundamentals are intact, valuations reset, and sentiment is at multi-year lows—positioning our long-horizon capital to capture potential outsized returns through our vertical-focused, data-driven approach.

Perpetual swaps have achieved product-market fit in crypto and are now scaling via decentralized exchanges like Hyperliquid, with improving execution and liquidity. The next growth phase lies in capturing retail derivatives flow - especially vs CFDs - supported by new infrastructure enabling expansion beyond crypto.